
Knoco Ltd has conducted a global survey of Knowledge management every three years, starting in April 2014, with the latest in September 2023. Participation has been free and confidential, and all participants received a free Knowledge Management Survey report. Nearly 1200 people have taken part in the surveys; mostly individuals leading Knowledge Management activities or members of Knowledge Management teams.
The main outputs from the reports are listed to the left. For many of the factors surveyed, we can now look at changes over the course of the 4 surveys (ie the last 10 years of KM). The latest survey report contains 110 graphs and 35 tables of data. Three of the graphs are presented and discussed here
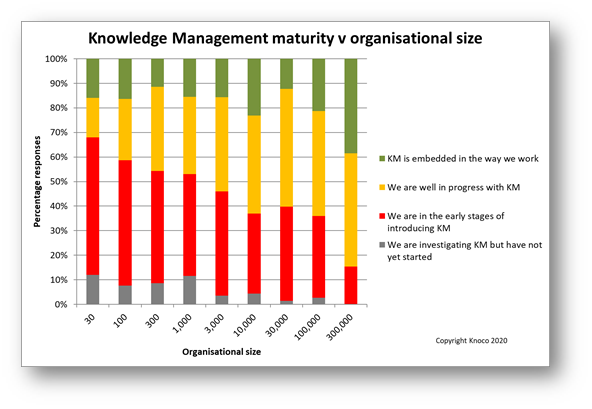
Among the data collected through the survey was a subjective assessment of the maturity of knowledge management, described as "We are investigating KM but have not yet started", "We are in the early stages of introducing KM", "We are well in progress with KM", and "KM is embedded in the way we work". The picture to the right shows how this maturity level varies with company size. Click on the picture to see a larger version.
It is clear that the larger organisations are the most mature. Knowledge Management has historically been a big-company activity, but smaller companies are increasingly in the early stages of implementation, or in progress. The exception to this trend is the smallest category of company, many of which are niche consultancies for whom Knowledge Management is business critical.
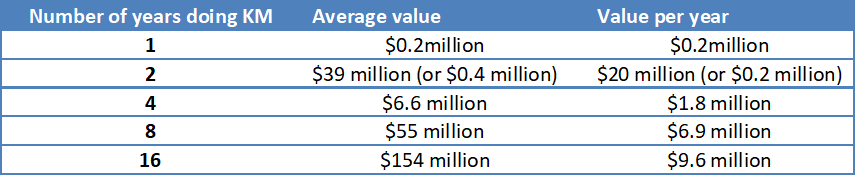
Among the data collected through the survey was a subjective assessment of the value delivered to date through knowledge management, in US dollars, with respondents choosing the most representative value figure from a list. This was an optional datapoint, and a total of over 200 respondents quoted a value number over the four surveys. The table to the right shows how the average delivered value varies with the length of time the organisation has been involved in Knowledge Management. Click on the table to see a larger version.
The larger value figure for 2 years is influenced by a single construction company. If this is removed, there is a clear relationship between the length of time doing KM, the overall value delivered, and the value delivery per year.
Participants were asked whether Communities of Practice (CoPs) formed part of their KM approach. This was an optional section, and about 400 people have answered this section across the four surveys.
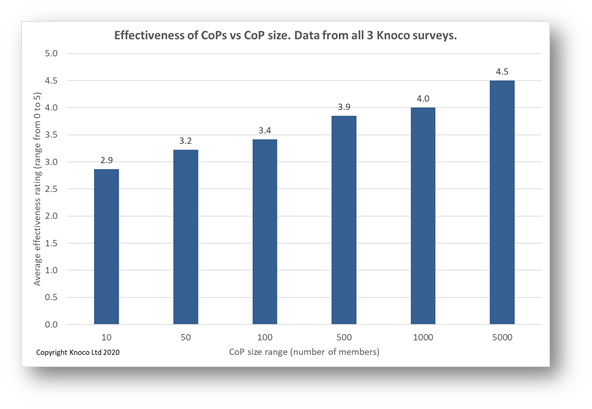
One of these questions covered the average size of CoPs, and another was a subjective assessment (marks out of 5) of Community effectiveness in delivering value.
From the plot shown here, there is a very close link between CoP size and perceived CoP effectiveness. Larger is better, and the largest CoPs were ranked as the most effective. However the survey showed that the majority of CoPs are small - the model size being 10 people, the median 50 and the mean 200.
We are now making the 2023 survey report available free of charge to anyone who wants it. All we ask in return is to know who you are, and what use you plan to make of the survey report. We have put a vast amount of work into the surveys, we are really proud of the report, and we are very interested in what people make of it and how they use it. So please fill in the order form below, and we will mail you a copy within a day or two. Your data submitted through this form will not be used for marketing purposes nor shared with any third parties, but will be securely retained to track interest in the survey and for potential follow-up on the value and application of the survey report.